Sales Insight Dashboard For Sales, Customer and Product Analysis
| Sudarshan Surname

| Position | Request | Purpose |
|---|---|---|
| Sales Manager | A dashboard displaying overview of Sales | To get to know top selling products and top purchasing customers |
| Sales Manager | A comparison between the target sales and the current sales | To get to know the growth rate |
| Customer Department | A detailed overview of sales generated from each customer each month | to understand the customers and to know to whom we can sell more |
| Product Department | Product Overview and detail of each product sales for each month and also worst selling and best selling subcategories | To understand which product gives use more and which to stock |
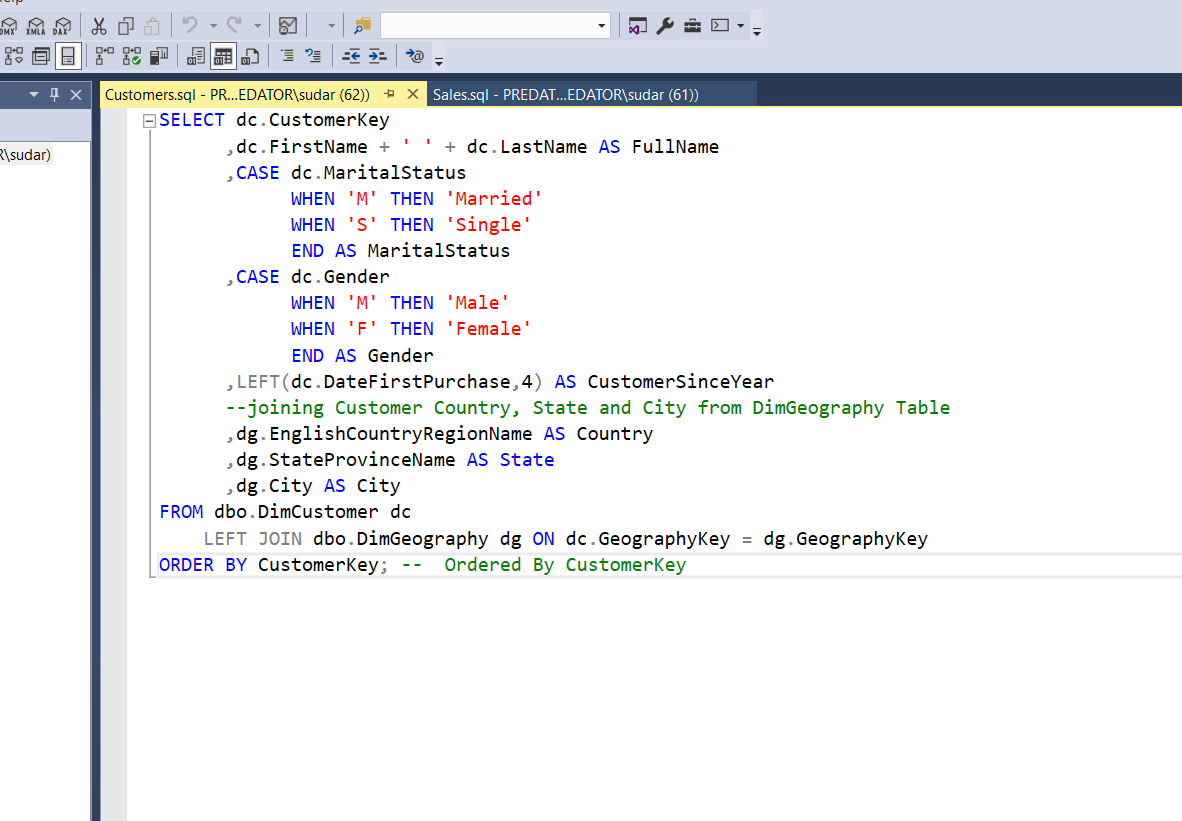
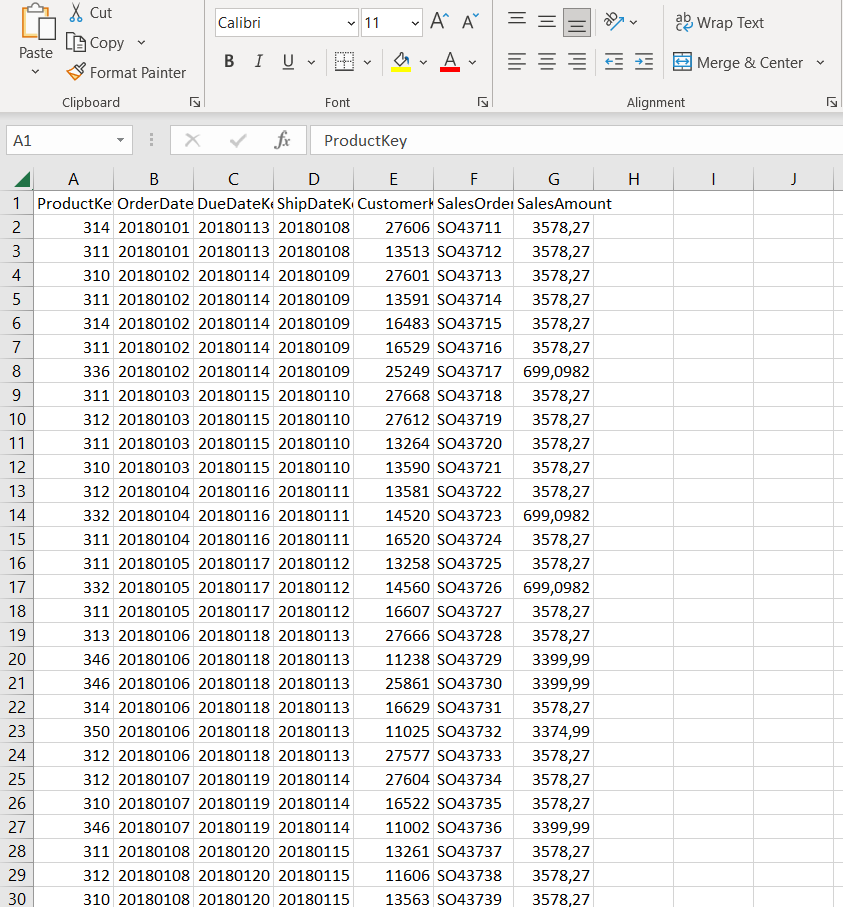
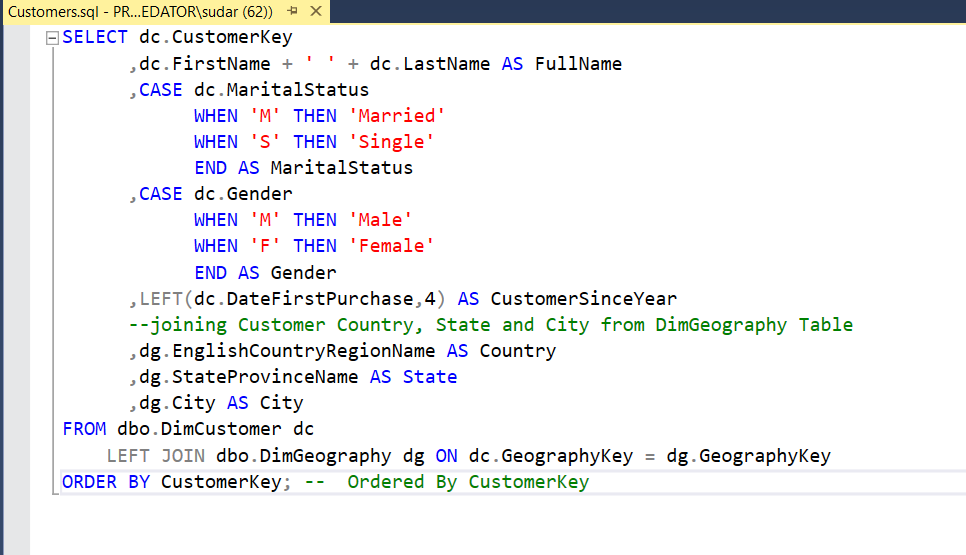
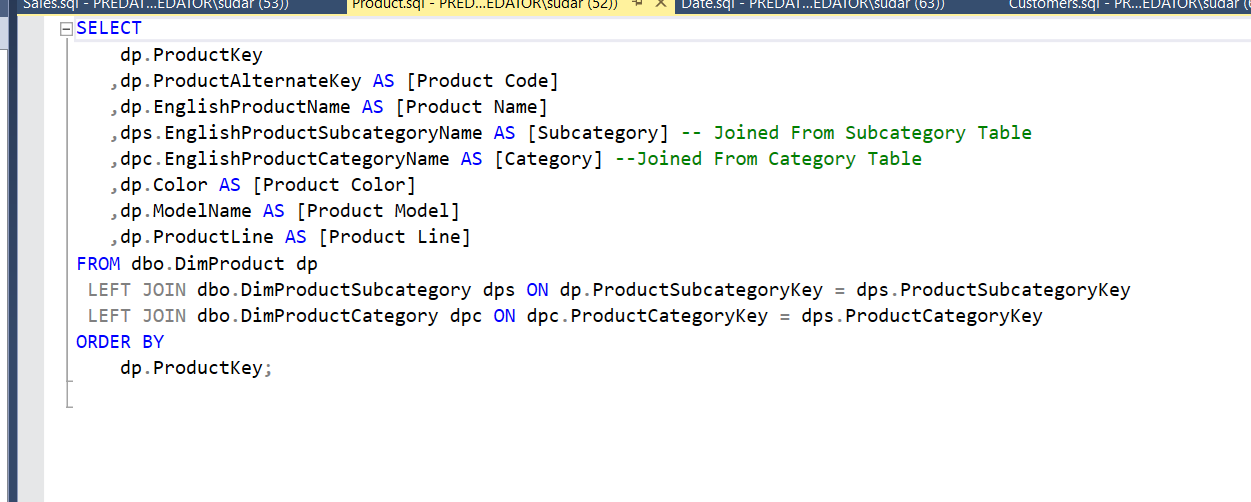
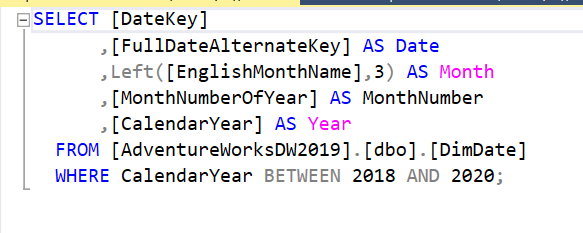
The data was present in the SQL server and based on the Business requirements, the data was extracted from the database. The queries used to extract and transform the data are shown below.

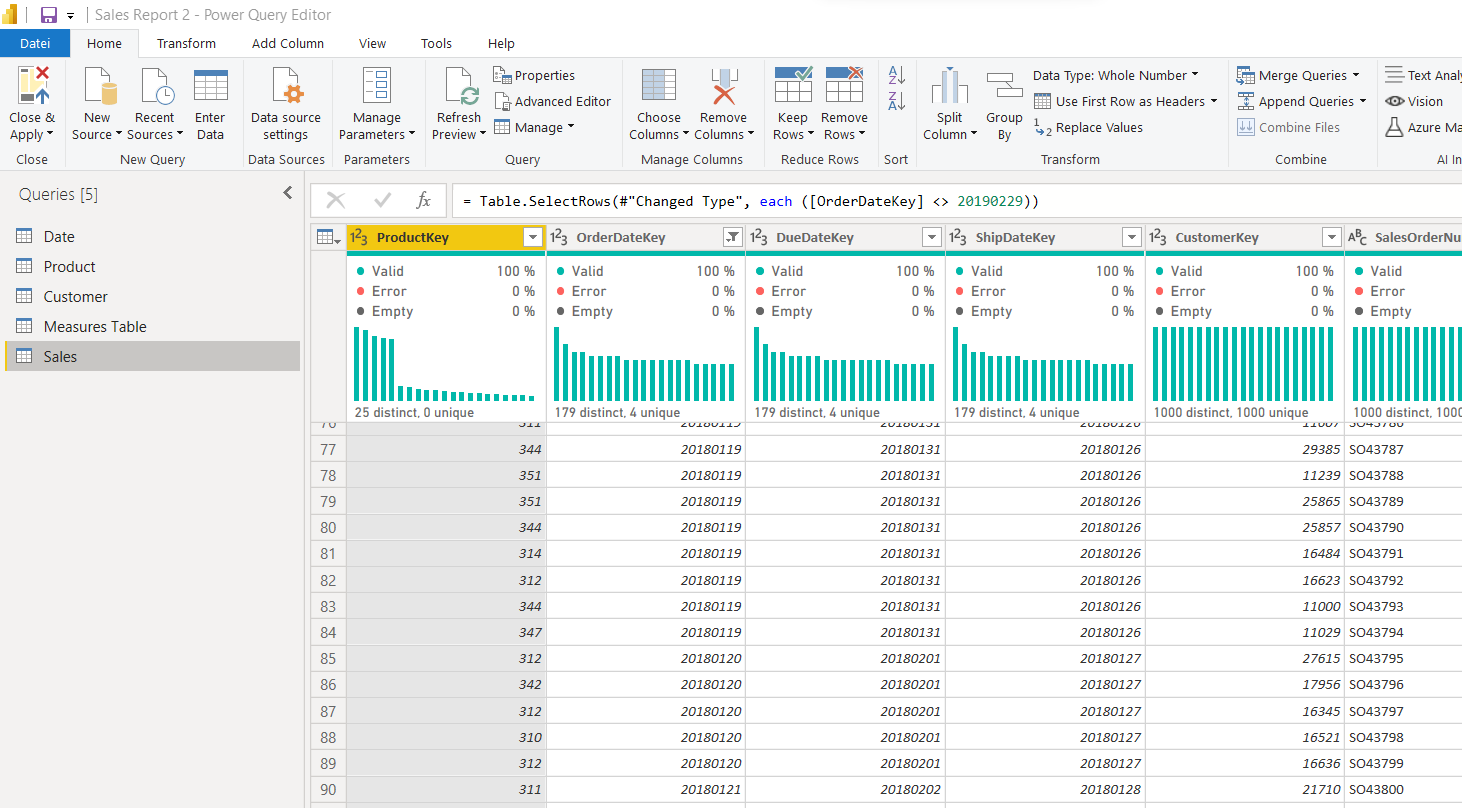
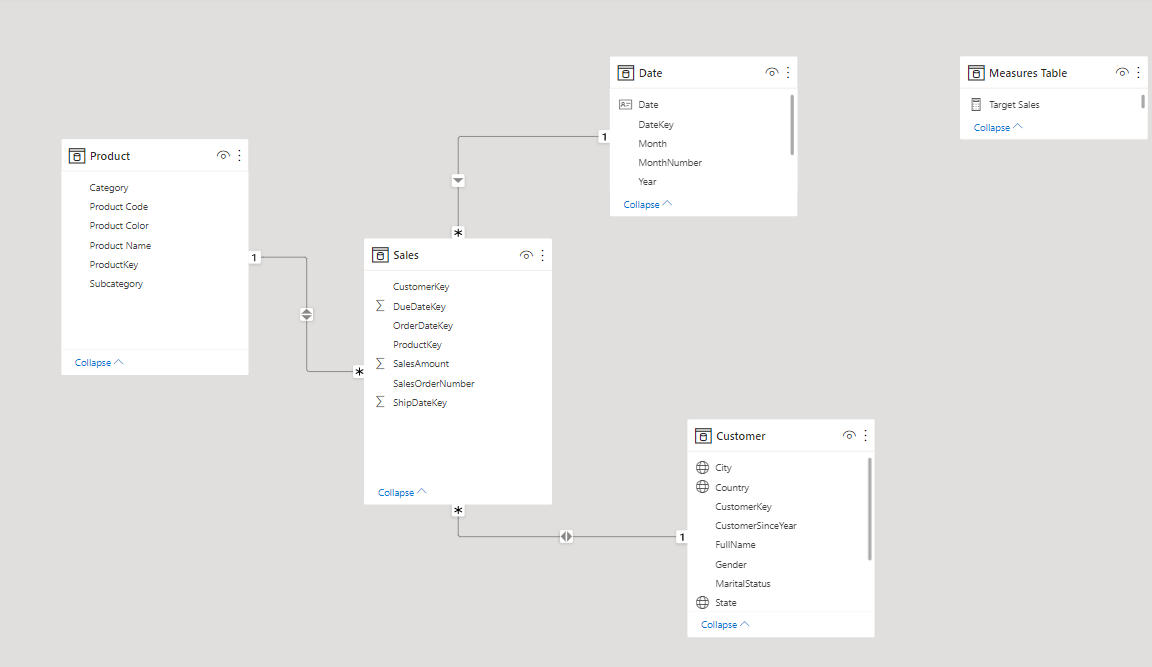
After some other transformation that were done in power query, such as replacing some null values with others and some remained cleaning. The data was loaded into Power BI and data model was built. The Sales Table is the fact table and Date, Product and Customer represents the dimension Table. Sales is the fact table. Below is the final structure of data model.
The Final dashboard contains 3 Pages. The pages are built as per the requirements. The Sales page, Customer Analysis Page and Product Analysis page.
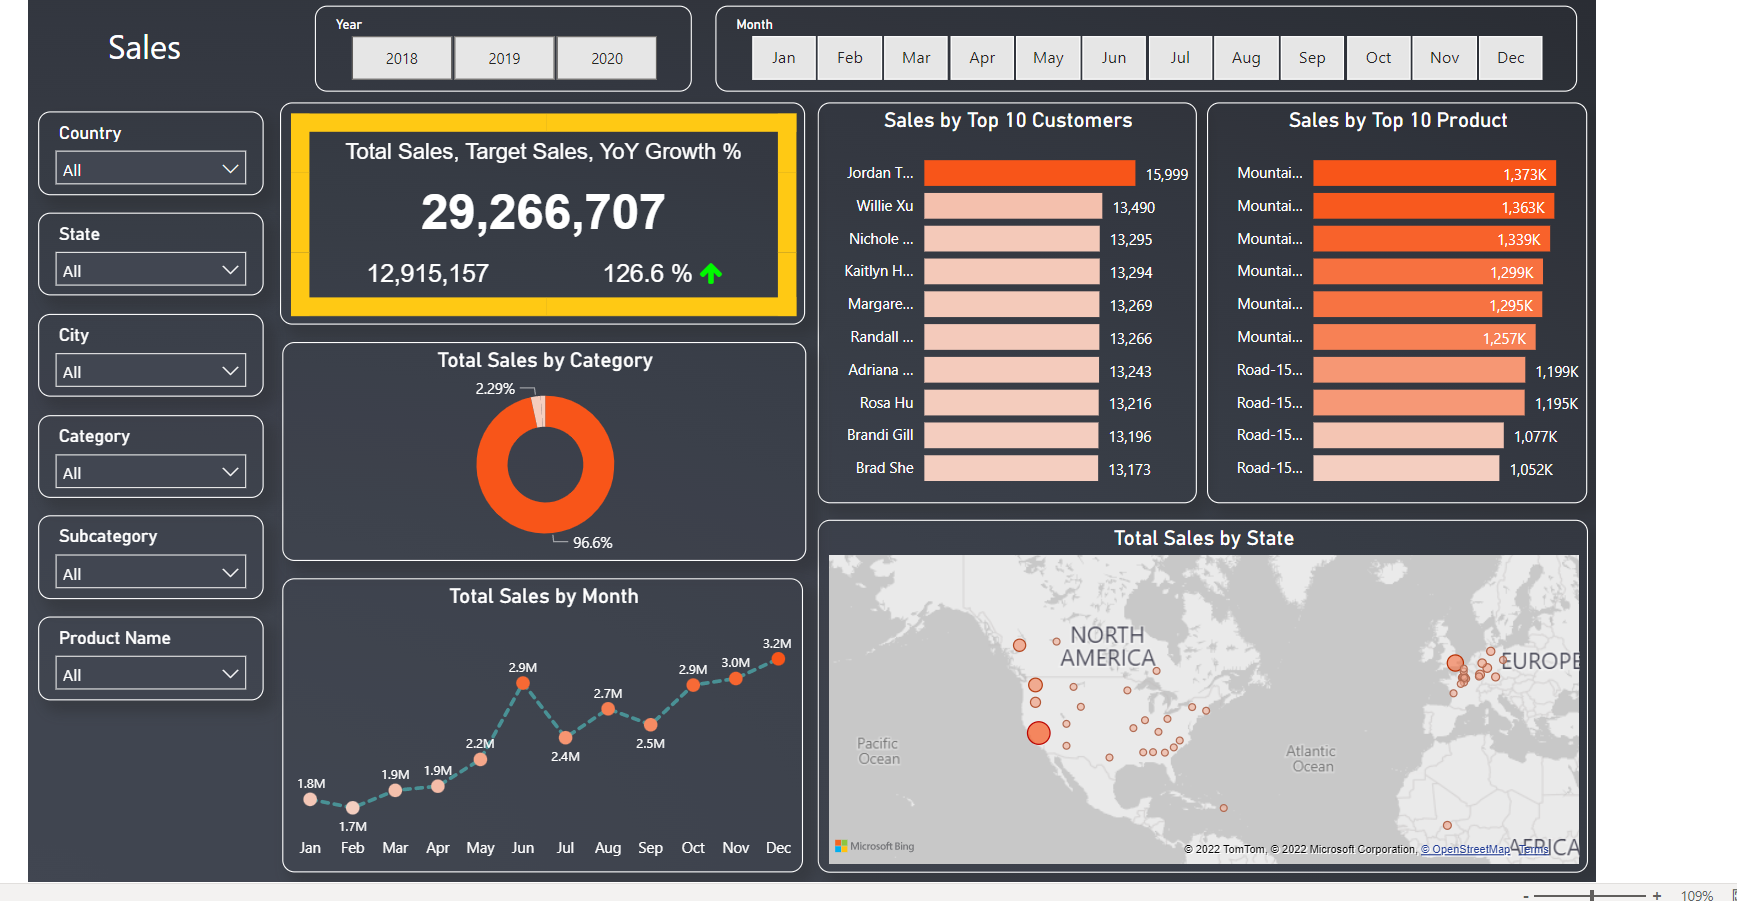
The Sales page is focused on the overview of sales. The dashboard is built based on requirements and some additional visuals are added to assist manager to make decisions. The page can be seen below.

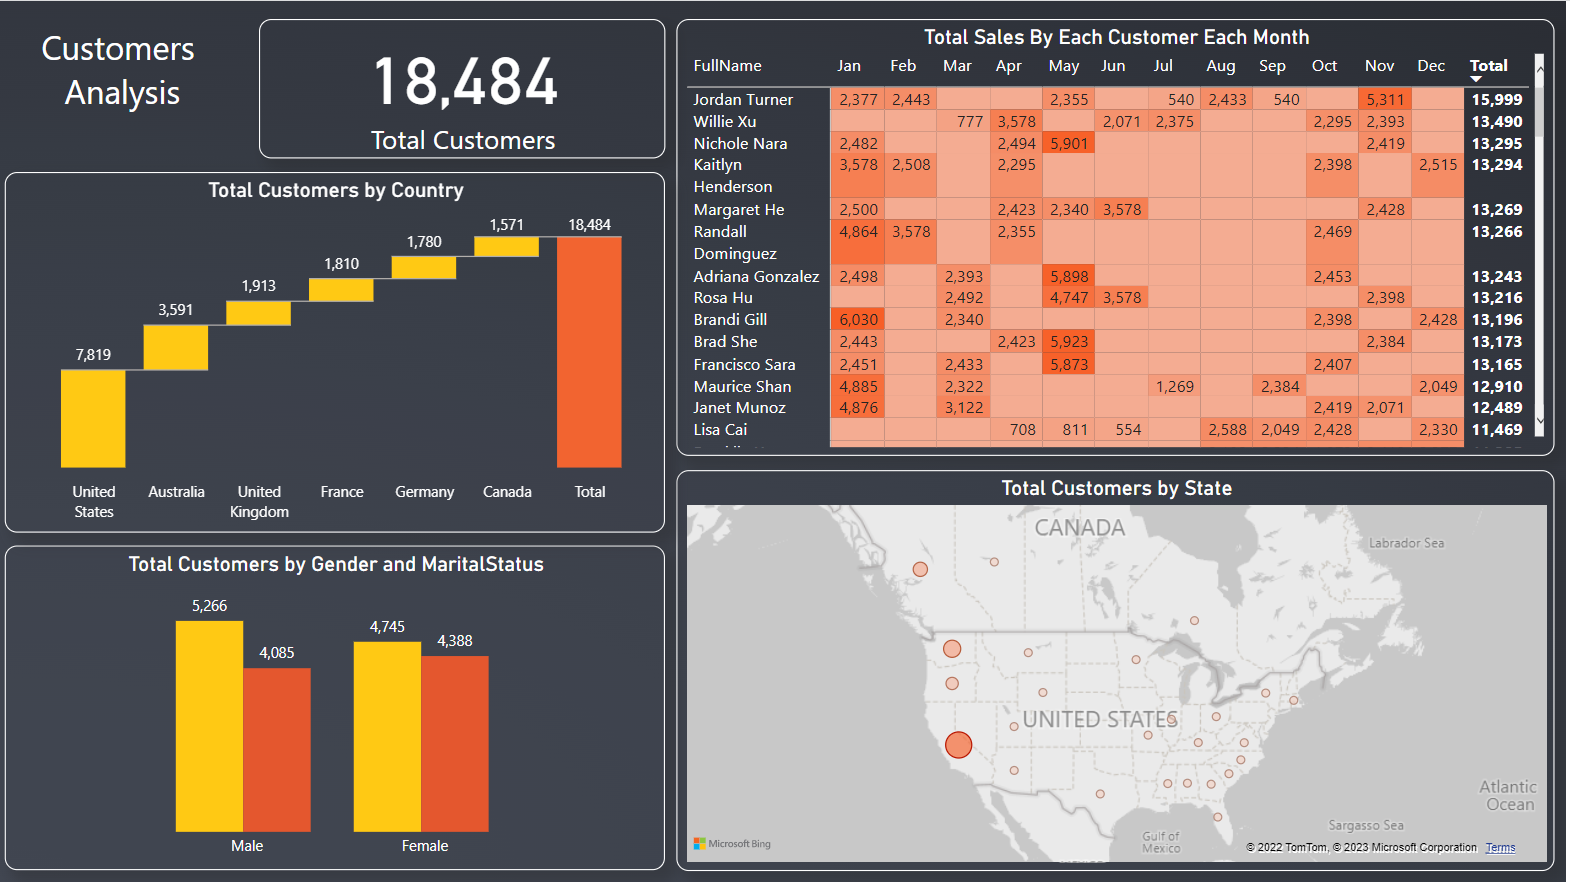
The customer analysis page is focused on the customer overview and the detailed data of customer purchase for each customer each month. The page can be seen below.
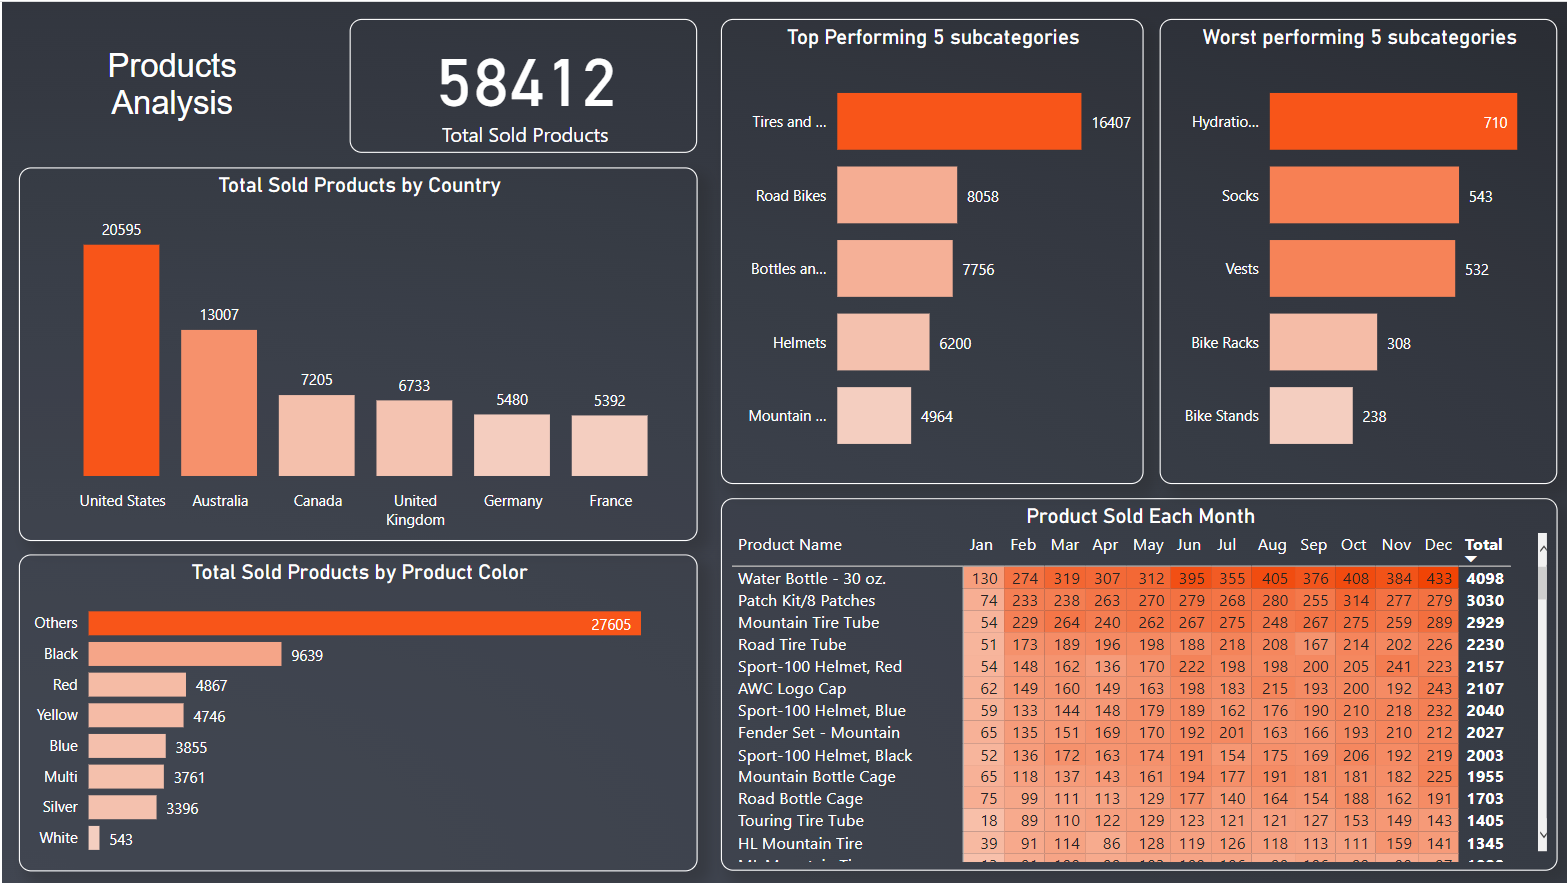
The product analysis page is focused on products overview, quantity sold details of each product each month and some additional data to assist product department. The page can be seen below.
The final interactive dashboard is deployed in Power BI Service and can be accessed from here.